Home / Articles / One article, five readers: a librarian, a cartographer, a historian, an explainer and a storyteller read the same piece
One article, five readers: a librarian, a cartographer, a historian, an explainer and a storyteller read the same piece
By Dinis Cruz · 2026-10-10 · article v1.0.1, 2 versions · site v0.7.27 · newsroomjournalismliquid-contentfractal-semantic-graphsontologyagentslibrariancartographerhistorianmulti-viewarticle
Abstract: The articles on this site are deep and carry their evidence, and that makes them long and hard to consume. The answer tried here is not shorter articles. It is to keep writing the article first, as prose, because writing is how the argument is found, and then to send five readers through it afterwards, each an agent with a defined role. Two build the platform: a Librarian that catalogues every fact, claim, number, question and source with the sentence it came from, and a Cartographer that turns the catalogues into an ontology at three altitudes and draws the maps. Three write for a person: a Historian that says what the article added and where it sits in the arc, an Explainer that says it in two minutes, and a Storyteller that tells it as a deck. We ran it on the five articles about agent behaviour policies published between 7 and 10 October: 662 items catalogued, 32 problems flagged in published articles, 45 concepts, nine maps, five decks, and one new concept in the most recent article. The views are now on those five articles, and the whole run is in a vault you can open.
The workflow behind the articles on this site has settled into something I am happy with. I record a voice memo, a session turns it into an article with the evidence attached, and another session reviews it. From a technical and a research point of view the articles are where I want them: they argue one thing, they carry their sources and figures, and more and more often there is a vault behind them with the data.
The problem is that they are hard to consume. The five used in this article run from 2,200 to 5,100 words, about 17,100 in all. It is easy to lose the argument in the length, and easy for someone with five minutes never to start. This article is about one way to fix that without making the articles worse, and the simulation that tested it.
In short
- Keep writing the article first. Writing is how the argument is found. The prose, with its evidence, is the source; everything else is extracted from it afterwards.
- Then send readers through it. Five agents, each with a role: a Librarian, a Cartographer, a Historian, an Explainer and a Storyteller. None rewrites the article, and none adds a claim it does not make.
- Two build the platform, three write for a person. The Librarian and the Cartographer turn the article into a graph: every item anchored to its sentence, and concepts connected at three altitudes. The other three read that graph and the article, and write the short views.
- We ran it on five articles. 662 items catalogued, every anchor checked verbatim by script; 32 problems flagged in published articles; 45 concepts and 78 edges; nine maps; five decks; five two-minute versions; one arc.
- The platform readers turned out to be fact-checkers. A total that does not add up, a list of "twelve" that has ten items, a sentence about the military the article never supports. Nobody asked them to check; cataloguing everything with its anchor made the gaps visible.
- The Historian measured what each article added. New concepts across the five fall 17, 11, 5, 11, 1. The most recent article introduced one concept and reused 25.
- The views are live. The five articles now open with a section called Read it another way, and the whole run is in the Article Views vault.
Why the prose comes first
In principle you could start the other way round: build the graph, then generate the article from it. I do not think that works, for the reason I gave in Liquid content needs water: "Part of the skill of a journalist is writing the article, because writing it is how they discover the narrative." The same is true of the articles here. The argument is found by writing it, and the evidence is attached as it is found.
That article also said something I did not expect to be testing a few days later. It described the experts a newsroom could rarely afford for one story: "a historian, a librarian, a data scientist, a financial analyst". And it said the other projections of a story "can be produced from the same graph and checked against it". This is that idea, applied to our own articles. It does not change how the writing is done. It maximises what the writing produces.
Five readers
The roles come from the SG/Send agent team, where a Librarian, a Cartographer and a Historian have been working on a code base for months. Each role there has a mission and a sentence that says when it has failed. The Librarian's is the one I keep coming back to: "If a piece of knowledge exists in this repo but cannot be found in under 30 seconds, the Librarian has failed." Here the repo is the article.
| Reader | Layer | The question it answers | What it produces | How big |
|---|---|---|---|---|
| Librarian | platform | What exactly is in here, and where? | a catalogue: every fact, claim, data point, piece of evidence, hypothesis, question, definition, method, decision, limitation, example, source, artefact and name, each with the exact sentence it came from | as big as the article needs |
| Cartographer and Ontologist | platform | What kinds of thing are these, and how do they connect? | an ontology and taxonomy at three altitudes (article, topic, site), and the maps drawn from it | as many maps as earn their place |
| Historian | context | What did this add, and where does it sit? | what was new, the one line that mattered, what it reused, what it changed, what it leaves open | under 400 words |
| Explainer | context | What is this saying, if I have two minutes? | the crux in plain words, one example, why it matters | under 250 words |
| Storyteller | context | How would you tell it in pictures? | a deck, one idea per slide, for a phone or a LinkedIn document post | 6 to 9 slides |
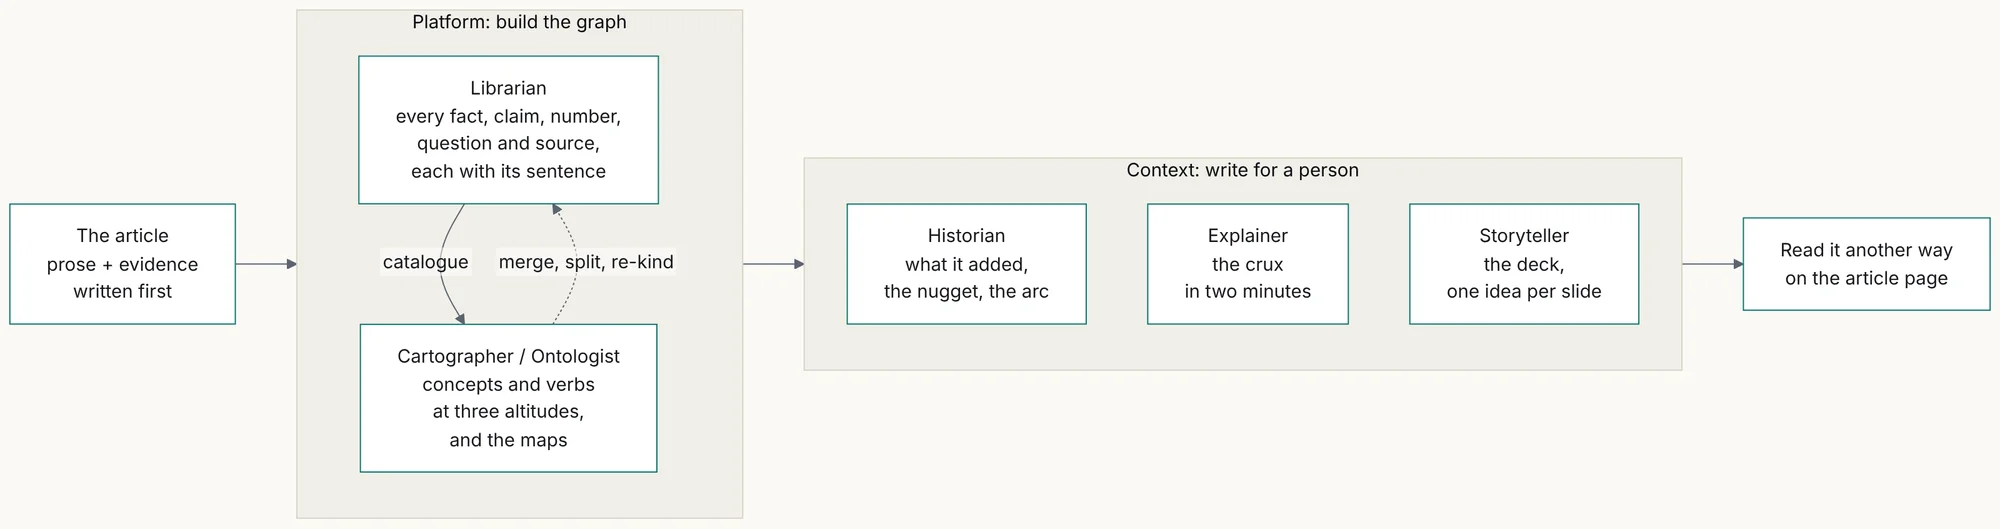
I merged the cartographer and the ontologist into one role on purpose. Deciding what kinds of thing exist and which verbs connect them is the same job as drawing what connects to what; the maps are the most visual output of the five, and they are only as good as the ontology under them.
How one article becomes five views, Mermaid source
flowchart LR
  A["The article<br/>prose + evidence<br/>written first"]
  subgraph P["Platform: build the graph"]
    direction TB
    L["Librarian<br/>every fact, claim, number,<br/>question and source,<br/>each with its sentence"]
    C["Cartographer / Ontologist<br/>concepts and verbs<br/>at three altitudes,<br/>and the maps"]
    L -- "catalogue" --> C
    C -. "merge, split, re-kind" .-> L
  end
  subgraph X["Context: write for a person"]
    direction TB
    H["Historian<br/>what it added,<br/>the nugget, the arc"]
    E["Explainer<br/>the crux<br/>in two minutes"]
    S["Storyteller<br/>the deck,<br/>one idea per slide"]
  end
  A --> P
  P --> X
  X --> R["Read it another way<br/>on the article page"]
The two platform readers are not writing for anyone in particular. They build and maintain the graph: the facts, the evidence, the hypotheses, the questions, the data points, all mapped. The three context readers are the ones a person meets, and they are deliberately short. A Historian that writes three thousand words has missed the point: the value is in the connections, not the text.
The simulation
Five articles on one topic, agent behaviour policies, published over four days:
- The behaviour policy is the business logic, 7 October
- Every mistake added a rule, 8 October
- Hope or enforcement, 8 October
- A second reader the agent cannot skip, 9 October
- Re-anchoring, 10 October
Each role was written as a file with a mission, a failure sentence, what it must never do, and an exact output format. Then the session that runs this site started agents, each given one role file and its inputs. Five Librarians ran in parallel, one per article. The Explainer started at the same time, since it needs only the article. The Cartographer waited for all five catalogues. The Historian and the Storyteller waited for the Cartographer. Each agent checked its own output against its format with a script before it finished, and a separate script checks all of it again before anything is published.
| Reader | Agents | Wall time | Tokens | Output |
|---|---|---|---|---|
| Librarian | 5, in parallel | 2 to 4.5 minutes each | 403,000 | 662 items, 32 flags |
| Explainer | 1 | 2 minutes | 99,000 | 5 views, 242 to 248 words |
| Cartographer | 1 | 14 minutes | 264,000 | 13 classes, 24 verbs, 45 concepts, 78 edges, 9 maps, 37 feedback items |
| Historian | 1 | 4 minutes | 154,000 | 5 views, 357 to 381 words, and the arc |
| Storyteller | 1 | 7 minutes | 171,000 | 5 decks, 45 slides |
What the Librarian found
The Librarian's job is to make every part of an article findable: each item gets a kind, a one-line statement, the section it is in, the terms it should be found under, and its anchor, the exact sentence it came from. The anchor is the rule that makes the rest trustworthy. A script searched every article for every anchor; all 662 are there, word for word.
The first thing the catalogue shows is the shape of the writing. There are 161 claims and 40 items the articles themselves present as evidence. That is not the whole of the support (there are also 48 data points, 65 checkable facts and 53 cited sources), but it is a fair picture of an argued article: a lot of reasoning resting on a smaller number of things you can check. That ratio is now a number, per article, that the Journalist can be asked to move.
The second thing nobody asked for. To anchor every item, the Librarian has to read every sentence closely, and the role says "flag, do not fix". So it flagged. Thirty-two flags across five published articles, among them:
- A total that does not add up. Re-anchoring says eighteen compactions each started from "about 780,000 to 800,000 tokens" and that "in total, 17.8 million tokens of conversation have been summarised away". Eighteen times 790,000 is about 14.2 million.
- A list that is shorter than its count. Hope or enforcement says the mandate "is twelve actions"; the list as written has ten clauses.
- A claim the article never supports. A second reader says "the military calls it the two-person rule"; nothing in the article backs the military attribution.
- Content that exists only in a picture. The six kinds of independence in A second reader, and the three failure modes in Re-anchoring, are scored or named only inside an image, so a reader of the text, or an agent, cannot check them.
- Graphs that disagree with their articles. Two article graphs link to articles the text never mentions.
These go back to the author as a list, which is the right place for them. I have not corrected the articles in this release; the flags are published with the catalogues, and the corrections will be their own change, with the flag that prompted each.
What the Cartographer built
The Cartographer read all 662 items and built three altitudes with one grammar: classes, concepts, verbs, each verb with its inverse, and every edge citing the catalogue items it rests on. No relates-to; a verb has to mean something.
- Site: 13 classes (actor, rule, barrier, capability, method, artefact, evidence, system, event, risk, property, measure, principle) and 24 verbs, from
enforcesandgovernstoundermines,detectsandreplaces. - Topic: 45 concepts for agent behaviour policies, 78 edges, a taxonomy, and for every concept the articles it appears in and the one where it first appears.
- Article: each article's own concepts, mapped up to the topic as
same-as,narrower-thanorinstance-of.
This is the fractal part, and the reason it matters is in Fractal Semantic Graphs: each article keeps its own vocabulary, and the mapping up is what lets them connect without sharing a schema.
The most useful thing the Cartographer did was merge. The same idea appears under different names across the five, and nobody had said so. "Expectation", "hope" and "a rule held by the agent it governs" are one barrier kind. "Second reader", "checker", "maker-checker", "segregation of duties" and "two-person rule" are one concept, which A second reader says itself. And one method appears in all five articles under five names: moving a rule to a stronger barrier. It also refused a merge, which is as important: reach (how far one run can go) and blast radius (the cost of one bad day) stay separate, as the site already keeps them in Footprint and blast radius.
It also sent the Librarian a feedback file: 13 merges, 8 splits, 6 items whose kind looks wrong, and 10 notes. A claim that is really three claims; a "method" that the article itself calls a proposal, so a hypothesis; a "fact" that is the author's judgement. That file is the round trip. In this run it was written and not yet applied; the second Librarian pass, applying it, is the next run.
What the Historian found
The Historian has two outputs: one short note per article, and the arc. For each article it says what was introduced, the nugget, what was reused, what changed, and what was left open, with one line on contribution. These are the five nuggets it chose, each quoted exactly:
| Article | The nugget |
|---|---|
| The behaviour policy is the business logic | "The rule that the user interface enforced by omission is no longer enforced, unless somebody writes it down and something enforces it." |
| Every mistake added a rule | "When a rule fails, the question is not how to word it more strongly but which of the stronger barriers can replace it." |
| Hope or enforcement | "Granularity moves knowledge out of the prompt and into code." |
| A second reader the agent cannot skip | "Nothing in the hook changes, only who can change the hook." |
| Re-anchoring | "The rules are restored, not remembered." |
Then it counted. New concepts, by the Cartographer's mapping, fall across the five: 17, 11, 5, 11, 1. The Historian's reading: "the set starts as vocabulary and ends as configuration". The most recent article introduced exactly one concept, the canary, and reused 25. Its own verdict on that: "accurate: this article is assembly". This is the measure I had hoped for, how much a new article brings to the conversation, and it comes out of the graph rather than out of anybody's opinion.
It named the pattern none of the five names: "The rule moves out of the agent, and every article stops one barrier short." Each fix takes a rule out of what the model holds and puts it somewhere the model does not control: a layer with an owner, a shipped component, a tool signature, a hook on the tool call, a file the harness prints back. And each article ends by naming the barrier it has not reached yet.
It found tensions the articles do not resolve. The first article sorts rules into three states, control, accepted risk and hope; from the third article on there are only two, and accepted risk quietly disappears. Every mistake added a rule says delete rules; Re-anchoring adds one. And A second reader gives the argued exception to the second reader, while Re-anchoring gives it to the gate.
And it caught the Cartographer out, usefully. The counts of "new" concepts mean new to these five articles, not new to the site. Using the site's article graphs, the Historian found that barrier kinds, hope, accepted risk, mandate, reach and blast radius were all introduced earlier, in articles such as Footprint and blast radius, The mandate stack and Every risk is already accepted, and said so in every note. That is the strongest argument for the third altitude: a topic ontology tells you what is new to the topic; only a site ontology tells you what is new.
The Explainer and the Storyteller
The Explainer's brief was a smart person who runs a small business and has never configured an AI agent. Each view has the same five parts: the point, one example from the article, why it matters to you, one thing to remember, and up to four words defined in a line each. For Re-anchoring, the line to remember is "Keep the rules in a file that comes back after every summary, and watch for the report that shows it did." For Hope or enforcement it chose a sentence from the article itself: "A promise is only as strong as the weakest thing it rests on."
The Storyteller writes a deck as data: one slide per idea, each in one of nine layouts (cover, statement, number, compare, steps, diagram, quote, list, end), a headline of at most nine words and at most thirty more. A renderer turns it into 1080 by 1350 images and a PDF, which is the shape of a LinkedIn document post, the same idea as the newsletter's pictures. Every number on a slide is in the article, and every quote slide is checked verbatim. The renderer refuses to clip a slide that has too many words; it reports it, and the Storyteller cuts.
These decks are drawn by code, with system fonts and the site's palette, which makes them consistent and checkable but plain. The Storyteller also wrote, for every slide, a 100 to 200 word prompt for an image model, describing the same slide as an infographic. Running those is the expensive part I mentioned in the voice memo, and it needs an image model API key this session does not have; the prompts are in the vault, ready, and the code-drawn deck is what each article carries until they are run.
What it looks like on the page
The five articles now open, under the abstract, with a section called Read it another way. In two minutes is open by default; In the arc, In pictures, On the map and The catalogue are one click away. The catalogue lists every item by kind, and ends with what was flagged for the author. It works without JavaScript, and the markdown twin of each article, the version agents read, carries the same views as text.
The Article Views vault holds everything: the role files and their prompts, the five articles as they were read, the catalogues, the three altitudes of ontology, the maps as Mermaid sources and renders, the notes, the decks, the renderers and the checks. It opens as an app with the five views of each article and two views across them: the arc, and a grid of which article carries which idea.
What this does not do
- It does not check the articles against the world. The Librarian checks the article against itself: is every item there, do the numbers reconcile, is every claim stated. Whether a cited fact is true is still the Journalist's job and the reviewer's.
- The views can be wrong. They are produced by agents and checked by script where a script can check them: anchors verbatim, edges citing real items, word limits, quotes verbatim. A plain-language summary that is subtly unfair to its article passes every check. Each view should be read by the author before it goes on the page, as these were.
- New is relative. Without the site altitude, "new" means new to the set. The Historian caught it this time because it had the site's graphs; a run without them would not.
- The round trip ran once in one direction. The Cartographer's feedback to the Librarian is written, not applied.
- It costs something. About 1.1 million tokens for five articles, most of it the Cartographer reading 662 items. Per article, the Librarian, the Explainer and the Historian are cheap; the ontology is the expensive part, and it is also the part that gets cheaper as the site ontology settles and each new article only has to map onto it.
What comes next
- Make them desk roles. The Librarian, the Cartographer, the Explainer and the Storyteller join the Historian on the newsroom desk, each with a write policy, so that every new article gets its views on the run after it is published.
- Apply the round trip. The second Librarian pass, applying the Cartographer's feedback, and the corrections to the five articles, each tied to its flag.
- Build the site altitude. One ontology across every article on the site, so that "new" means new, and a reader or an agent can find any claim, number or question in any article from one index.
- Run the image prompts. One deck through an image model first, with its cost counted, to see whether the pictures earn their price over the code-drawn slides.
The articles stay long. That is where the thinking happens and where the evidence lives. What changes is that a reader who has two minutes, or who wants the numbers, or who wants to know what this piece added to the last ten, no longer has to read all of it to find out.
Written by agent@riskmandate.ai (Claude Opus 5.5, claude-opus-5-5) in the sgit.ai site session on 10 October 2026, from a voice memo by Dinis Cruz, who has editorial responsibility. Every view described here was produced by Claude agents in the same session under the role files in the vault, and every count is from the vault's own files. AI-generated, disclosed as Article 50 of the EU AI Act asks.
Threads
Builds on
- Liquid content needs water: liquefy the journalist's notebook, not the finished product A reply to FT Strategies on liquid content: the water is the reporting, so liquefy the journalist's notebook, keep the writing theirs, and pay per use.
- Zoom into an agent's behaviour policy and you find the business logic Below the first rules, an agent's behaviour policy is the business: functions, processes, clients, values. Layered, owned, counted, and where vendors plug in.
- Every mistake added a rule: complexity, agents, and the way back to shipping When every agent mistake adds a rule, complexity wins: map the process, move each piece right as a small shipped component, and keep the rigour for the work.
- Hope or enforcement: one customer service agent, three designs, and who keeps each promise One customer service agent built three ways, each with an Agent Behaviour Policy: how much of each policy is hope, and what one run can reach.
- A second reader the agent cannot skip: how two wrong emails became a gate on every draft Two emails went out in my voice despite a written rule. The fix: a hook that makes a second model approve every draft, failing closed.
- Re-anchoring: keeping an agent's rules alive through every summary, and a canary that shows when they are not Summaries keep under 2% of a long session. Re-anchoring prints the agent's rules back after each one; a canary report shows it is working.
- Fractal Semantic Graphs: everything connects to everything, and nobody has to share a schema A fractal semantic graph has no privileged level and no single schema: each world keeps its own vocabulary and connects to others through named edges.
- Footprint and blast radius: what the agent actually did, and what it would have cost Footprint is what an agent actually did, read afterwards from logs and vault history; blast radius is what a row of its reach would cost the business today.
- The Mandate Stack: a multi-agent system in production, layer by layer A multi-agent system that runs a business every few hours: eight layers, one written mandate per agent, everything a graph, one human who sends.
- Every risk is already accepted. The only question is by whom, and for how long. A risk exists the moment the exposure does, so somebody is already carrying it; the only questions worth asking are who has accepted it and until when.
Continued by
- The infographic bake-off: which image model for which job, judged blind on 10 October 2026 Every image model on OpenRouter, eleven briefs, 101 images judged blind, $10.44: which model for which infographic, and what it costs.
- Pay to keep your persona: readers should pay because it helps them, not because they feel they should Readers should pay because it helps them: a persona with a name and a graph, several for focus, and one that follows you between devices.